November Private Client Letter - A Complicated and Shifting Environment
/A Complicated and Shifting Environment
Bear market rallies are defined as short-lived recoveries of 5% or more in stock prices during a broader period of market decline. They are effectively brief cycles of optimism that drive prices up temporarily before bearish sentiment takes hold once again. The bear market following the dot-com bubble (2000-2002) experienced eight bear market rallies before the market reached its true bottom. In the case of the financial crisis (2007-2009) the resulting bear market saw twelve bear market rallies that ultimately failed, prior to the onset of a new bull market.
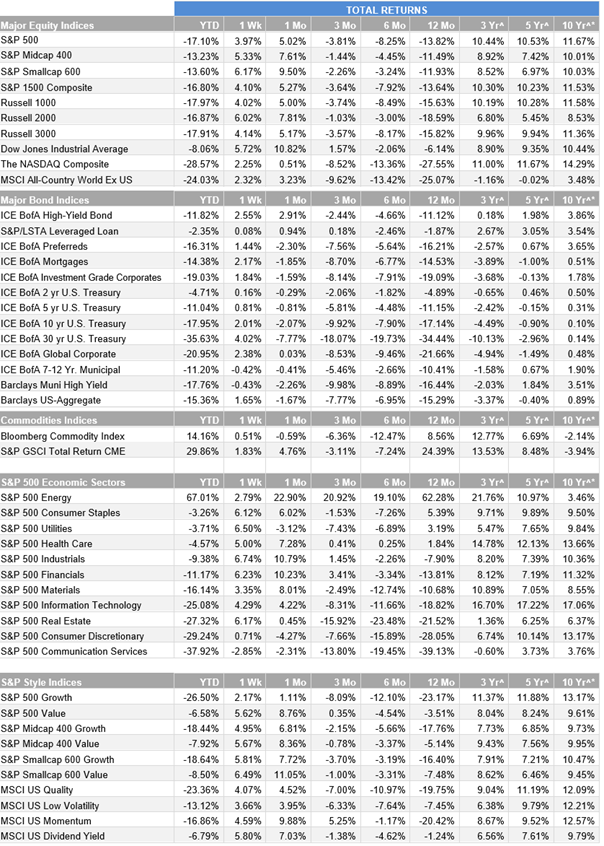
Historically speaking, bear market rallies are quite common and often spectacular. Typically, the more severe a bear market is, the longer and more intense these countertrend rallies can be. Case in point, the Dow Jones Industrial Average had its best October in history and the best month overall since January of 1976, rallying by almost 14%. Other than January of 1976, no month since the 1930s has done better. Likewise, the S&P 500 and the NASDAQ rallied in October with gains of 8% and 4%, respectively.
(Other historical data for major market indices is provided in Appendix A of this Private Client Letter).
Eventually all bear markets do come to an end and new bull markets are born. That’s the good news. The bad news is that bear market rallies are notoriously difficult to navigate because they appear quite convincing. They launch from recognized thresholds of support and can push through levels of resistance – often very rapidly and with compelling volume. We also know that one of the countertrend rallies will eventually be THE rally that takes stocks out of the bear market and into a new bull market cycle. We just don’t know how many failed attempts will come our way before this happens.
Given the historic precedent for numerous bear market rallies to fall flat before one comes along that launches a new bull cycle (with sustained higher prices), it is difficult to get too excited over the recent surge.
Behind the current rally are investor expectations that the Fed will hike the federal funds rate two more times before year end and pause early next year. In theory, inflation would then have a chance to moderate further without overly tight Fed policy causing a hard-landing recession. Unfortunately, this rush of optimism regarding a Fed “pivot” isn’t consistent with current economic data or with the Fed’s asserted framework for battling inflation.
While recent economic details, including corporate earnings, have not yet confirmed the bearish forecasts from a growing number of economists, recent reports are indicating a sharp deterioration in economic activity. Flash readings for U.S. manufacturing and services point toward the economy sliding into contraction territory. Confidence is eroding quickly within ISM data and the outlook from U.S. companies “among the lowest in survey history” (BESPOKE). Conditions around the world show similar trends.
Accordingly, the broader outlook for corporate earnings going into 2023 continues to weaken with the recent strength in the U.S. dollar representing a major headwind for overseas profits.
In the U.S., home building declined at a 26.4% annual rate in the third quarter, the sixth consecutive quarterly drop and the largest decline since COVID first hit the U.S. This is important because the real estate sector is critically important to the overall economy. Commercial construction fell at a 15.4% annual rate, also the sixth consecutive negative quarter and the weakest since COVID first hit. While the country may not have officially entered a recession, the construction industry already appears to be in a recession of its own.
The U.S. consumer is the dominant component of economic activity. Unfortunately, “real” (inflation-adjusted) earnings are falling and consumer purchasing power has taken a big hit. That, along with a reduction in bank balances (previously pumped up with government stimulus dollars), make it not easy to be optimistic about consumer spending over the next 12 to 18 months.
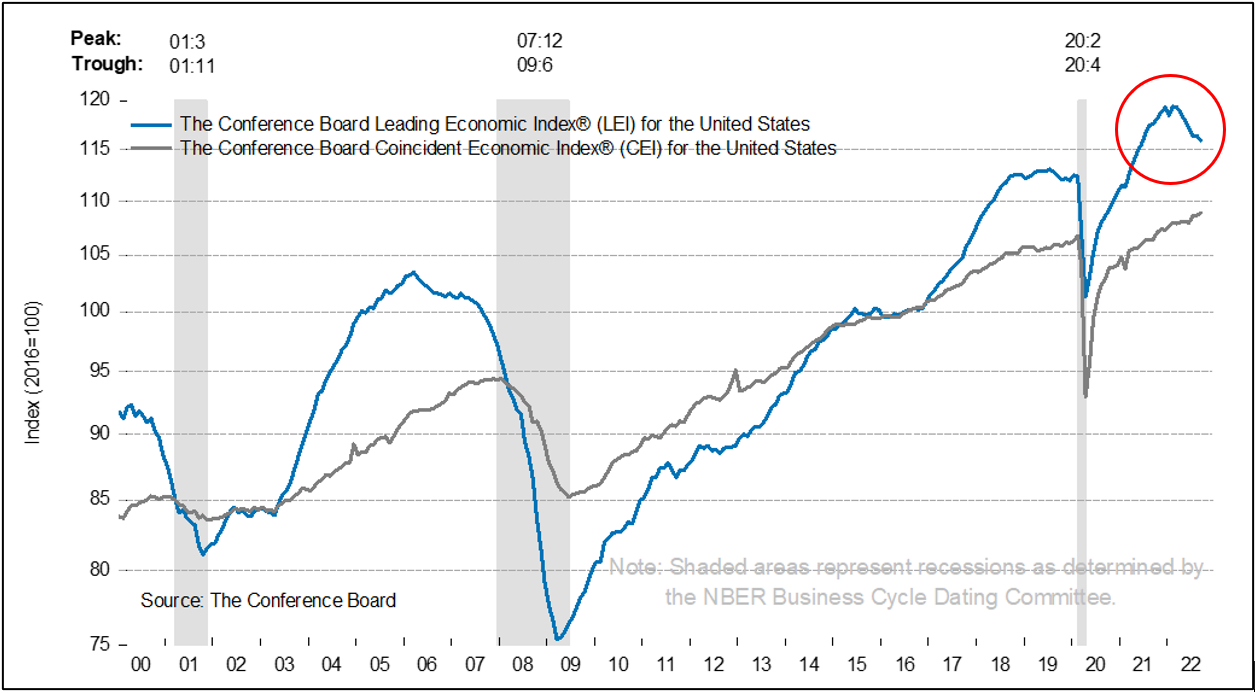
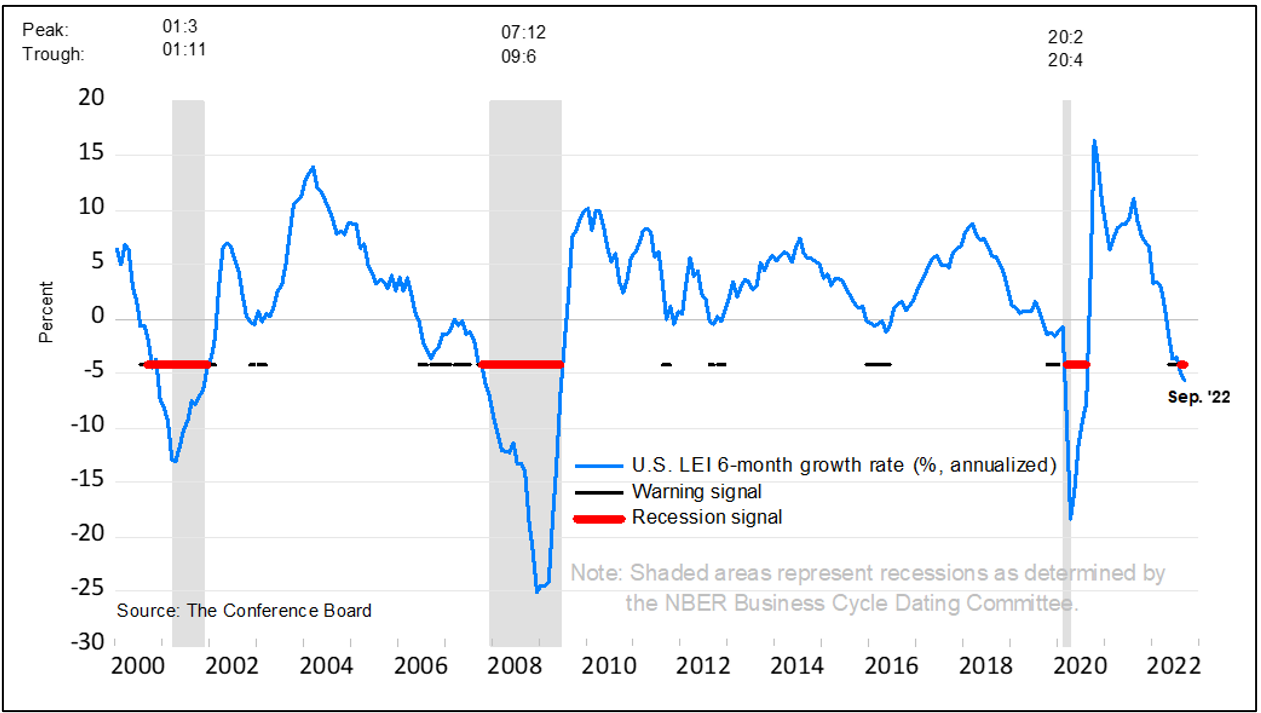
The Conference Board Leading Economic Index® (LEI) for the U.S. decreased by 0.4% in September, after remaining unchanged in August. The LEI is now down 2.8% over the six-month period between March and September 2022. This is a stark reversal from its 1.4 % growth over the previous six months.
The index looks forward using 10 metrics that include manufacturing hours worked, jobless claims, building permits, stock market indexes and credit spreads. A cresting pattern in the LEI, followed by a downturn, has historically preceded recessions (grey shaded vertical bars on graph).
US. LEI declined further signaling an elevated likelihood of recession
Recessions risks continued to persist through the third quarter
The six-month growth rate of the LEI fell deeper into negative territory in September, and weaknesses among the leading indicators were widespread. Amid high inflation, slowing labor markets, rising interest rates, and tighter credit conditions, The Conference Board is now forecasting real GDP growth will be 1.5% year-over-year in 2022, before slowing further in the first half of next year.
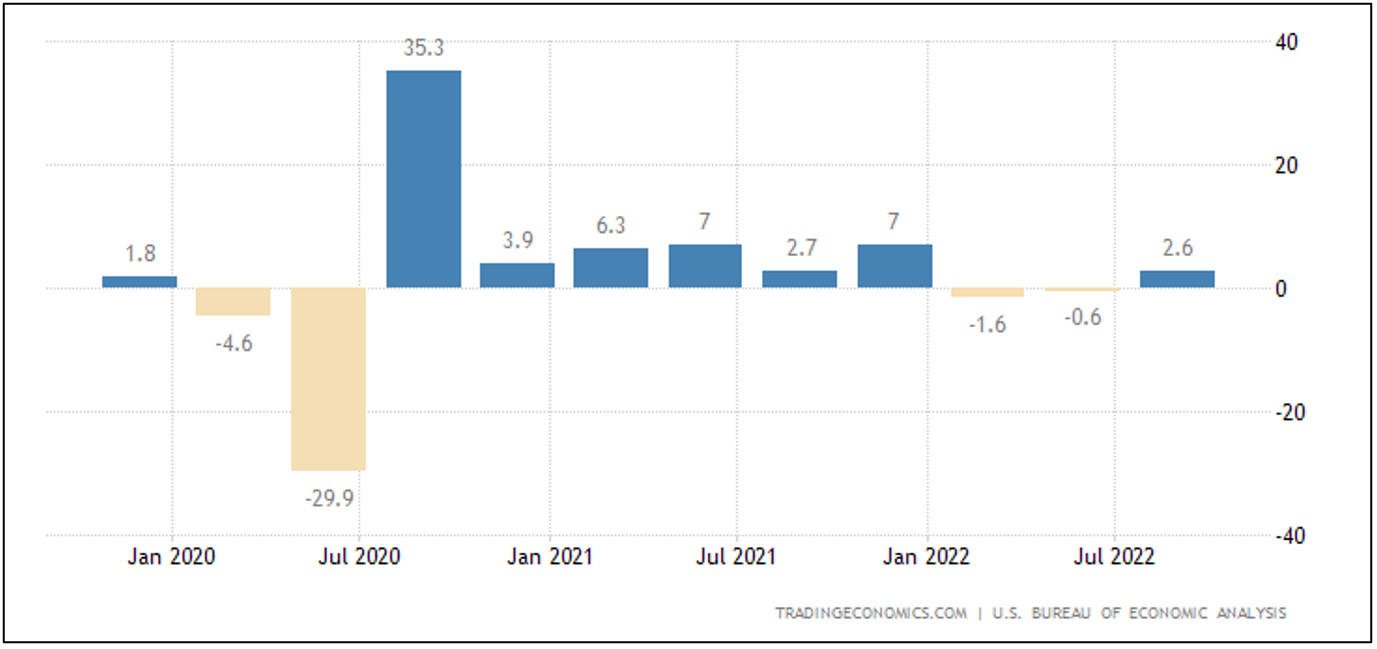
After back-to-back negative quarters in the first half of the year, the first reading on third quarter GDP showed growth of +2.6% quarter over quarter annualized (chart below). A surge in exports and higher inventories provided a lift to the numbers just as consumption weakened broadly.
Core GDP (personal consumption, business investment, and home building) rose a paltry 0.1% in the quarter. Overall, the growth bounce wasn’t very impressive and is likely unsustainable in the quarters ahead. As our friend Brian Wesbury recently observed, the current growth rate in core GDP is what we usually see just before, during, or after recessions.
Inflation remains a problem and the Fed is unlikely to shift away from further monetary tightening anytime soon. Core PCE (Personal Consumption Expenditures) remains the Fed’s preferred inflation index and it is still rising at an annualized pace of 5.5%. The Fed is also expressly focused on the tight labor market and wage inflation. While the Employment Cost Index (ECI) in October showed annual growth in private wages and salaries slowed from 5.7% to 5.2%, it is still too high to be consistent with the Fed’s target inflation rate of 2.0%.
These data points only serve as more evidence suggesting additional Fed tightening lies ahead. We believe the Fed will need to see a sustained decline in several inflation indicators before they let up on tightening monetary policy.
On November 8th, the US will hold midterm elections with control of the Senate and House at stake. With poll numbers indicating Republicans could potentially seize control of Congress, political gridlock could dominate the remaining two years of President Biden’s term in office. This said, we would not expect significant policy initiatives to help bolster economic activity in this timeframe, nor are we likely to see large government spending programs that could further fuel inflation.
A ”softish landing”, such as was recently suggested by Fed chair Jerome Powell, is still possible. However, conditions are shifting rapidly, and the Fed’s hawkish stance shows no signs of abating. About the best we can hope for over the near-term is some moderation in the Fed’s message about rate hikes in 2023. Accordingly, the economic risks associated with a policy mistake are elevated and a recession now appears likely next year. If the Fed continues its crusade of tight monetary policy, even as inflation shows signs that it has peaked, an economic downturn will be inevitable.
We have long promised our clients that when the facts change, our outlook would change. This said, our base case has shifted to a less constructive view of the economy over the next 12 to 18 months. We now expect that economic growth to disappoint and a recession to occur 2023. However , we are not expecting the recession to be particularly long or deep. By mid-2023 the worst may be behind us, and risk assets could begin a sustained move higher. Given current financial conditions and other reasonably stable fundamentals, the coming recession will likely be relatively short and shallow.
This said, the economy is not the market, and the market is not the economy. This point is of critical importance for investors. The equity market is a forward-looking mechanism that attempts to anticipate what is on the horizon; it is not always a direct reflection of current conditions. Typically, a new bull market will begin months before the economy shows measurable signs of improvement. In fact, bull markets typically begin well before a recession is declared to have ended, and the early rallies can be extraordinarily strong.
It has always been true that bad times follow good times and good times follow bad times. The economy could easily deteriorate further in the near-term, however it will likely get better over the longer-term. Over the next 12 months any broad market rally could potentially mark the beginning of the next bull market, however it could just as easily be a false countertrend move that stalls out. Unfortunately, the only way to distinguish between the two is with hindsight.
It is for this reason that we believe investors are best served by sticking with long-term strategies and resisting any temptation to time the markets. We simply do not know for sure how long, or how deep, any given recession will be. When the market does turn, the early movement in equity prices is often violently higher. Missing out on those initial rallies can have a distinctly negative impact to an investor’s total return over the course of the next bull market.
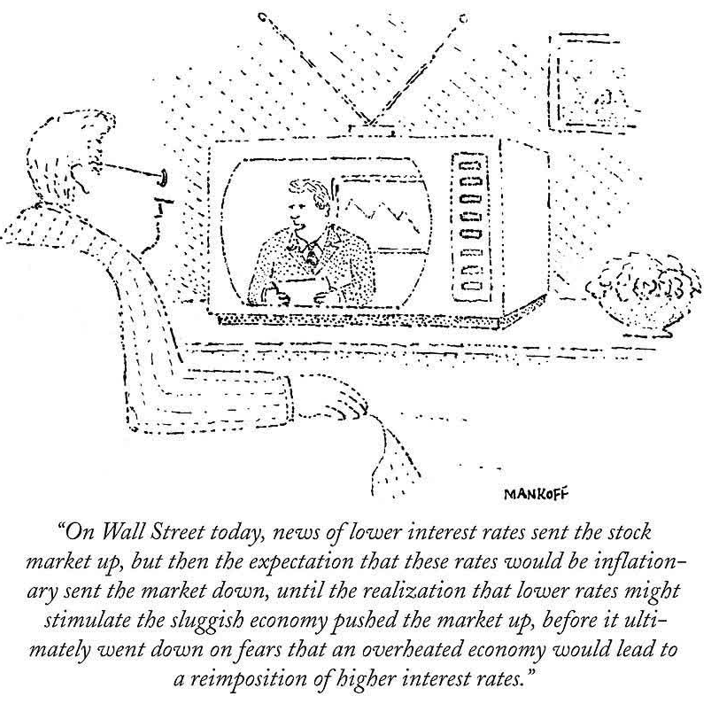
Andres Cardenal, CFA (one of my favorite market commentators) recently shared the cartoon above in his blog. It originally appeared in The New Yorker in the 1980s; the last time inflation gripped the nation as it does today. Forty years later, this cartoon almost perfectly describes the current obsession over interest rates and inflation. Somethings never change and we are well advised to avoid being caught up in short-term volatility.
On Wednesday, November 2nd the Fed will announce their decision regarding another interest rate hike. We expect an increase in the Fed Funds rate of 0.75%, which would put the Fed Funds rate at 3.88%. That would leave another 0.50% rate in December for the Fed to hit their end-of-year target rate of 4.4%. February will bring the first FOMC meeting of 2023 and the Fed would only need to raise by another 0.25% to reach their projected terminal rate of 4.60%.
More important will be the language the Fed uses at the press conference to telegraph their intentions for their next FOMC meeting in December. Monetary policymakers have repeatedly expressed their commitment to fighting inflation with higher interest rates and tighter financial conditions. While many market participants are hoping for a dovish shift in the Fed’s tone, we believe it is more likely that they will maintain a firmly hawkish posture (for now).
Such a scenario could produce a new spike in volatility and the current bear market rally could come under pressure. This would be an unpleasant short-term development, but it is part of a larger process in which bear markets test, and re-test lows, in order to establish a reliable bottom.
Our expectation is for the equity markets to remain range bound for another year, or possibly a bit longer. There will be sharp rallies with brief periods of optimism followed by renewed waves of bearish sentiment and panic selling. Bear markets “reset” valuations for future gains and are a natural part of investing. Investors with planning horizons spanning years (not months) are generally better served staying the course with properly diversified strategies.
At the peak of the global financial crisis in 2009, the economy contracted over four consecutive quarters, unemployment topped 10%, and the S&P 500 was down almost 50% from the 2007 highs. It was a notably stressful time for investors, and many opted out to “stop the pain”. While the economy would exhibit further weakness, a recovery was taking shape and the equity markets turned sharply higher. After the March 9th bottom, the S&P 500 was up 30% by mid-May and by over 60% by the end of the year.
In the 2009 bear market, as in just about every other in history, positioning for a market rebound meant being invested when everything looked and felt its worst. Throughout history bear markets end when news is bad, and sometimes still getting worse. We are now anticipating more bad news just ahead. Unemployment is likely to rise, corporate earnings estimates will be lowered, and we will likely receive confirmation that the U.S. economy has slipped into a recession. All of this will likely cause bearish investment commentary to intensify.
What happens next is what investors need to be planning for now. Staying with well-structured strategies following the 2009 bear market meant having the opportunity to participate in the +451.3% gains over 10.8 years that U.S. stocks would deliver (S&P 500). If the current bear market cycle ends like most previous ones have, the bottom in equities will occur even as news on profits, GDP, and employment continues to get worse.
Patience will be a priority in the coming months. From 1942 to the present situation, the average bear market lasted approximately 11.1 months with an average magnitude of -31.7%. Over the same period, however, the average bull market lasted 4.4 years with an average magnitude of +155.7% (Zack’s). Investors should recognize that bull markets have historically been longer and stronger than bear markets.
We know none of this is easy, however there is a lot at stake when the bear market finally gives way to a new bull market. Over the past year we have acted in our portfolio strategies to reduce risk, increase quality, and address the adverse impact higher interest rates have on bonds. At this point in time, there is not anything that we would be doing that we haven’t already done. We feel that we are properly positioned for the current phase of the market cycle and will continue to make adjustments as may be necessary.
As always, thank you for your continued confidence. Please reach out should you have any questions or concerns.
John E. Chapman
November 2022
Total Returns as of October 28, 2022 / * As of last month end / ^ Annualized Returns
An index cannot be purchased directly by investors. Indexes do not charge management fees or brokerage expenses, and no such fees or expenses were deducted from the performance shown. Past performance is no guarantee of future results. The information presented is not intended to constitute an investment recommendation for, or advice to, any specific person. By providing this information, Clearwater Capital Partners is not undertaking to give advice in any fiduciary capacity within the meaning of ERISA, the Internal Revenue Code or any other regulatory framework.


