

Yield Curve Inversion: Could It Be Different This Time?
/An inverted yield curve has become a prominent indicator within the financial world that suggests a recession may be on the horizon. Currently, the yield curve is near the most inverted we have seen in over 40 years.
The yield curve is the graphical representation of the difference in interest rates across various maturities as shown below. Typically, the yield curve is positively sloping with the interest rates on longer-term debt being higher than shorter-term debt. This makes sense as the longer you “lock up” your capital, the more risk you are taking, and therefore, you would expect a higher return. However, on rare occasions, you can have an inverted yield curve whereby short-term rates are higher than long-term rates.
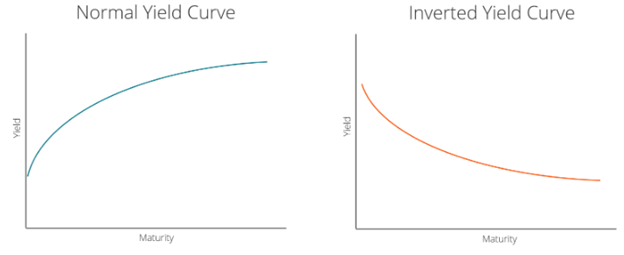
Source: Corporate Finance Institute
Inverted yield curves are typically associated with slow economic growth or recessions. The 10-year Treasury bond is considered by many investors as one of the safest securities in the world and, when risks of a recession are rising, investors pile money into this safe-haven asset driving the price of the bond up and the yield down. This flight to quality can lead to the yield being pushed down to the point where it is below short-term yields, thus giving us an inverted yield curve.
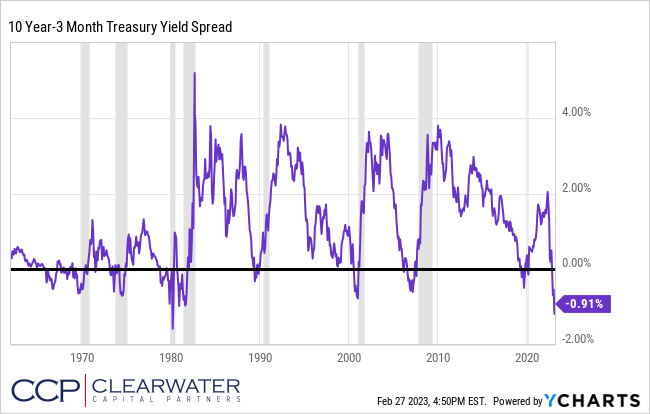
While there are many points along the yield curve that can be measured, one of the more popular yield curve measurements is the difference in yields (spread) between the 10-year Treasury bond and the 3-month Treasury bond. The chart below tracks this spread going back to the 1960’s along with the shaded grey areas that indicate recessions. Any time the spread goes below 0% reflects an inverted yield curve and, as you can see, there are plenty of examples where we had an inverted yield curve before a recession. It should be noted that although there are plenty of times in history where an inverted yield curve has indeed signaled a recession, there are times where it has given a false signal.
Looking at the last 8 recessions, the 10 year – 3 month spread inverted before all of them, so why could this time be any different? For the purposes of this writing, we’ll stay focused on the yield curve and one aspect that is intriguing about this yield curve is the assumed path of inflation.
One of the key macroeconomic factors affecting bond yields is inflation. Investors will require higher yields if inflation is higher than environments when inflation is low. In the decade of the 2010’s, we had average inflation of 1.78% and an average 10 year Treasury yield of 2.41%. Conversely, in the 1970’s where inflation averaged 7.09%, the average 10 year Treasury yield during that time was 7.50%. Of course, there are other factors that will contribute to the 10 year Treasury yield, but inflation is certainly one of them.
While the nominal yield curve has inverted, inflation expectations are also inverted. Meaning the market is signaling that inflation, which is at 6.41% currently, will be lower in the months and years ahead. For example, the 10 year breakeven rate is around 2.36% which represents the market’s expectation for average inflation over the next 10 years and is far lower than today’s current inflation rate. Thus, it’s understandable that if the market is pricing in that significant of a drop in inflation that longer term yields would be lower than short term yields.
When adjusting the yield curve for inflation and inflation expectations you actually end up with a positive sloping real yield curve as shown by the black line in the chart below.

An interpretation of this could be that if inflation follows the expected course lower, the nominal yield curve inversion is simply reflecting that element and not necessarily forecasting a recession.
Granted, not only does the path of inflation need to come down naturally, but the huge variable in this equation is the Federal Reserve’s monetary policy and risks of a Fed policy mistake.
The economy is far too complex to be boiled down to any one indicator and though the inverted yield curve has a pretty good track record, it should not be solely relied upon. We give credit to the 2019 inverted yield curve for forecasting the 2020 recession, but did it really forecast the Covid-19 pandemic and shutdown of the economy?
The inflation outlook leading to a positive real yield curve compared to one of the most inverted nominal yield curves we have seen in over 40 years makes this a unique situation in history. Recessions are always defined and measured after the fact so time will tell if this yield curve inversion is truly signaling a recession or if this could be a false signal.
